Trading Central’s research department offers three sets of tools for Metaquotes’ MT4 to assist investors with optimal investment decisions. These include:
Alpha Generation, Risk Management and Indicators Lab.
Alpha Generation
Alpha Generation provides investors with 3 cutting-edge tools to help investors improve their investment returns on a risk adjusted basis:
- Analyst Opinion Indicator
- Adaptive Candlesticks
- Adaptive Divergence Convergence Signals
1. Analyst Opinion Indicator
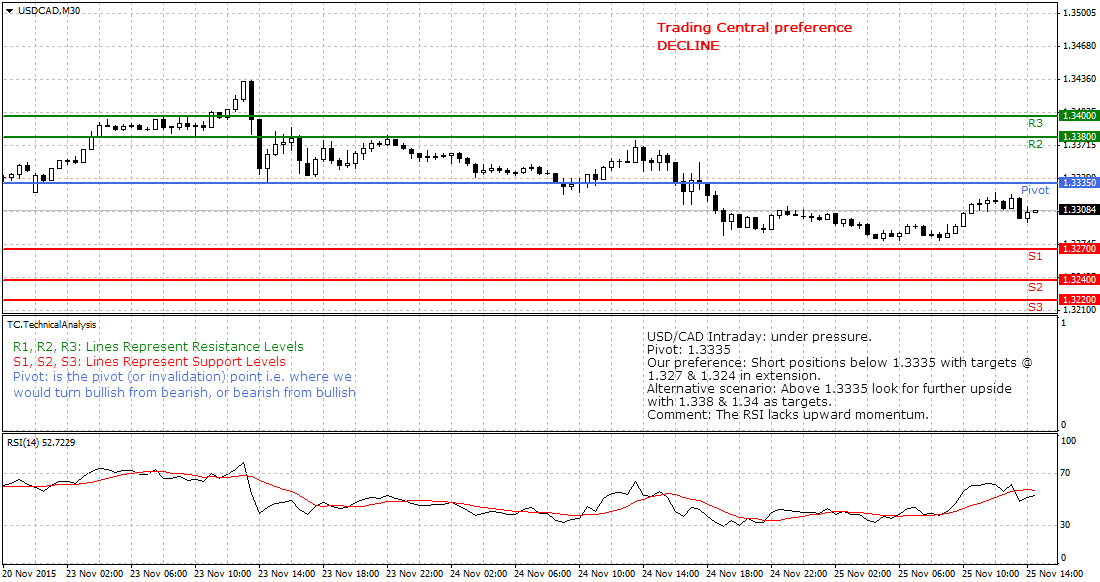
This indicator overlays research, forecasts, commentary and key levels (support/resistance/targets/stop pivots) from Trading Central’s analysts onto MT4 live charts on the most actively traded instruments. It displays the latest opinion of Trading Central analysts based on various timeframes on an intraday (30 min chart), short term (daily chart) or midterm (weekly chart) basis. It is possible to program and fill in orders based on analysts levels.
2. Adaptive Candlesticks
Candlestick charts highlight changes in the underlying supply/demand lines. Trading Central has picked out 16 patterns which they believe represent market psychology or emotion best, combining them with unique quantitative and technical expertise.
Trading Central Adaptive Candlesticks (TCAC) mark an MT4 chart with valid open-high-low-close prices with patterns that are perceived to be the most appropriate for decision making while removing patterns that are less relevant in the context of previous occurrences in the market and technical analysis. TCAC recognises in real time reversal and continuation candlesticks patterns that help improve trading skills and timing.
TCAC can be used to more effectively enter and exit the market while managing risk more appropriately. This approach can be used on any time frame and while TCAC does not provide price targets, it provides useful timing signals and can be combined with its Analyst Opinion Indicator.
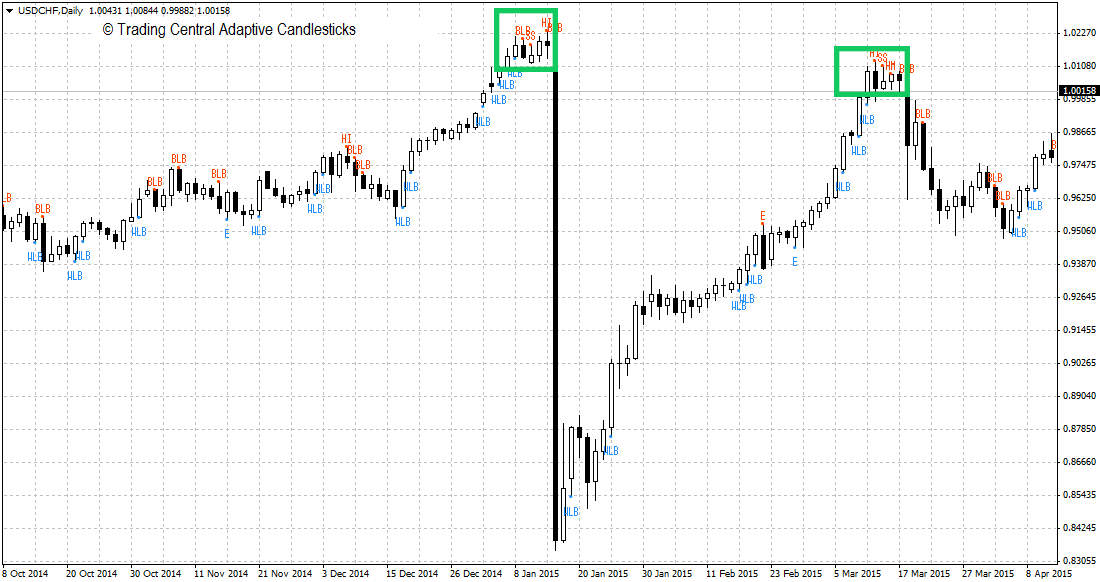
USD/CHF daily chart, in January 2015 and March 2015 the pair accumulated reversal patterns before declining sharply (green rectangles)
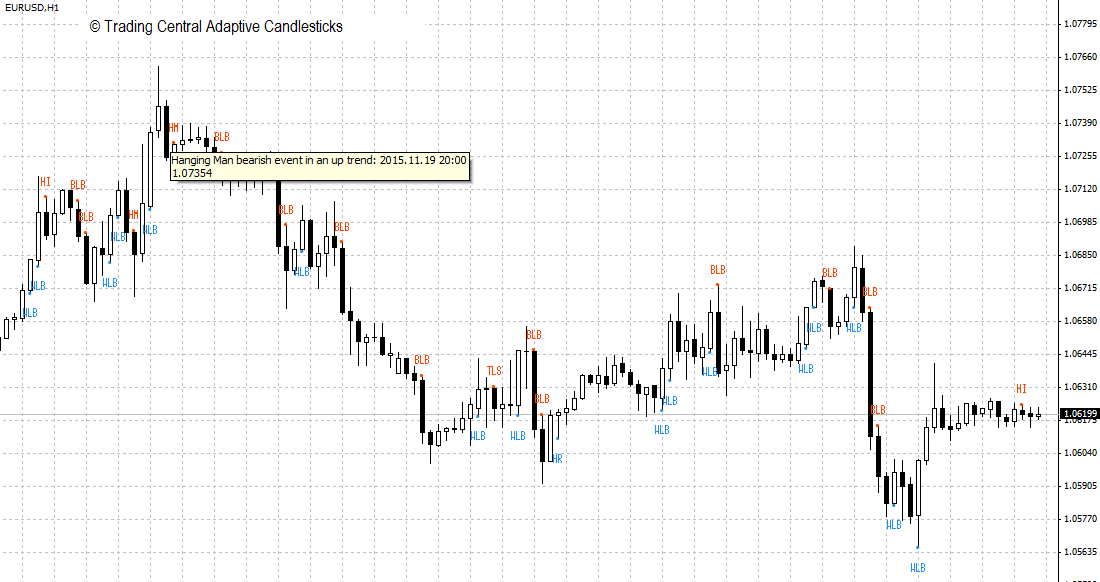
You can roll your mouse over a mark up to reveal more information on a candlestick.
3. Adaptive Divergence Convergence Signals
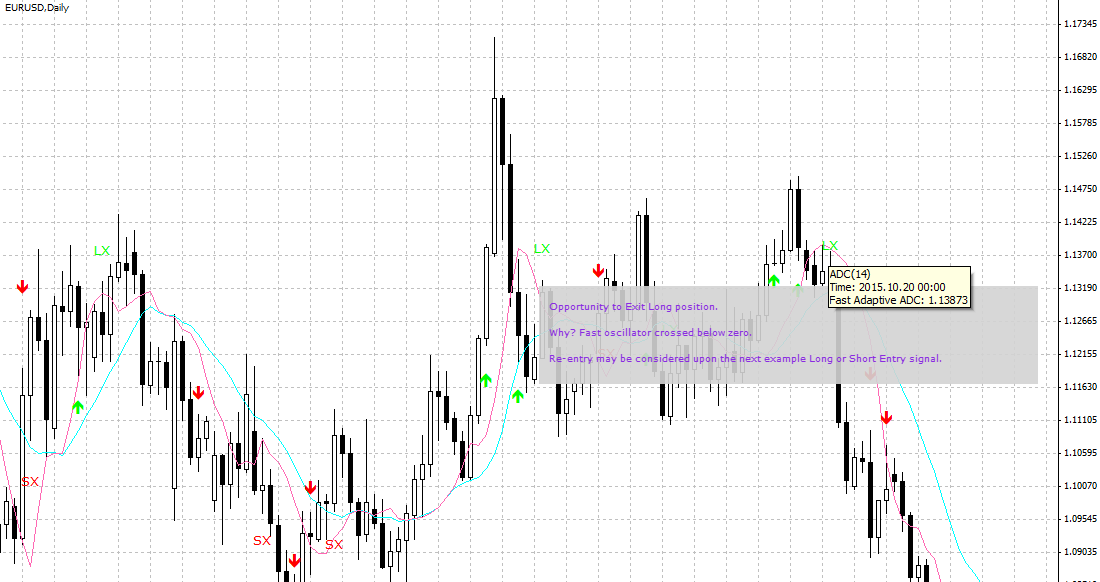
Adaptive Divergence Convergence (ADC) adapts its effective lengths in accordance with changing market conditions becoming shorter in trending markets and longer in sideways markets. It becomes more practical for short-term trading by avoiding excessive signals and guarding against sideways markets.
In addition to ADC's equivalent of MACD's indicators, two consistent oscillators (one slow, and one fast) are also derived from the analysis to assist with support trading decisions. ADC is very easy to optimise as it has only one parameter, and for the same reason is almost impossible to overfit.
USD/JPY 30 min chart. With TRADING CENTRAL Adaptive Divergence & Convergence Indicator you can visualise on any chart entry and exit signals candidates.

Further information on entry and exit signals can be found by rolling your mouse over the mark up.
Risk Management
Risk Management provides 2 useful tools to help you deal with uncertainty in trading:
- Probabilistic Market Classifiers
- Probabilistic Stops
1. Probabilistic Market Classifiers
The majority of indicator-derived trading signals have a tendency to lose money in sideways markets. This is because the logic behind their design implicitly views the markets as either bullish or bearish and does not incorporate a strategy for dealing with sideways.
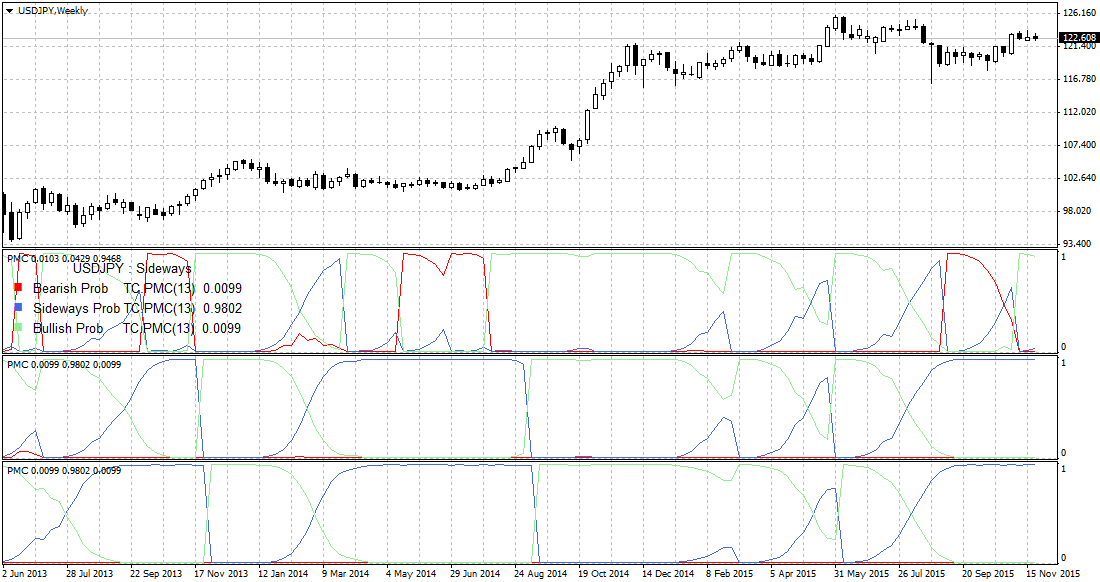
Probabilistic Market Classifiers (PMCs) deliver probabilities of markets being bullish, bearish or sideways and offer a capability to confirm a market class indicated by a trading signal so that unconfirmed trading signals can be ignored and potential losses avoided.
The onset of a sideways market may also be an optimal time to consider selling options. PMCs are unique in offering both entry and exit signals to take advantage of the decay of time premiums.
The PMCs will provide a probability of between 0 and 100 for a bearish, sideways and bullish market.
EUR/USD weekly chart. In May 2014 when the EUR/USD was trading around 1.3610 the PMC indicator point started to point toward a high probability of decline (red line).

It is also possible to combine multiple periods for a better probability outlook. It is recommended to use 5, 8 and 13 in the input periods parameter.
2. Probabilistic Stops
One of the main reasons for needing probabilistic stops is to bring greater consistency to the chances of being stopped out by finding a best-compromise price to allow for normal fluctuations but triggering the stop if the underlying price moves against the trade.
The rationale for stop orders is to protect a trade from excessive losses. Stops need to be wide enough not to be triggered by routine price fluctuations but close enough to be triggered if the underlying price signal behaves contrary to expectations. Given this requirement, a stop should reflect the reasonable limit of price fluctuations from wherever the local mean is currently.
In the input parameter box you can chose the length and width of the probabilistic stops you want to set-up.
USD/CAD 15 min chart. TRADING CENTRAL Probabilistic Stops Indicator helps you see on any time frame where stop levels could be positioned.

Indicators Lab
Indicators Lab gives you access to indicators that may be useful for those doing their own trading systems, back testing and are looking for out of the box thinking indicators.
- Regularised Momentum
- Regularised Buying Selling Pressure
- Regularised RSI
1. Regularised Momentum
Momentum can be a noisy quantity and frequently needs to be averaged before sensible inferences can be made.
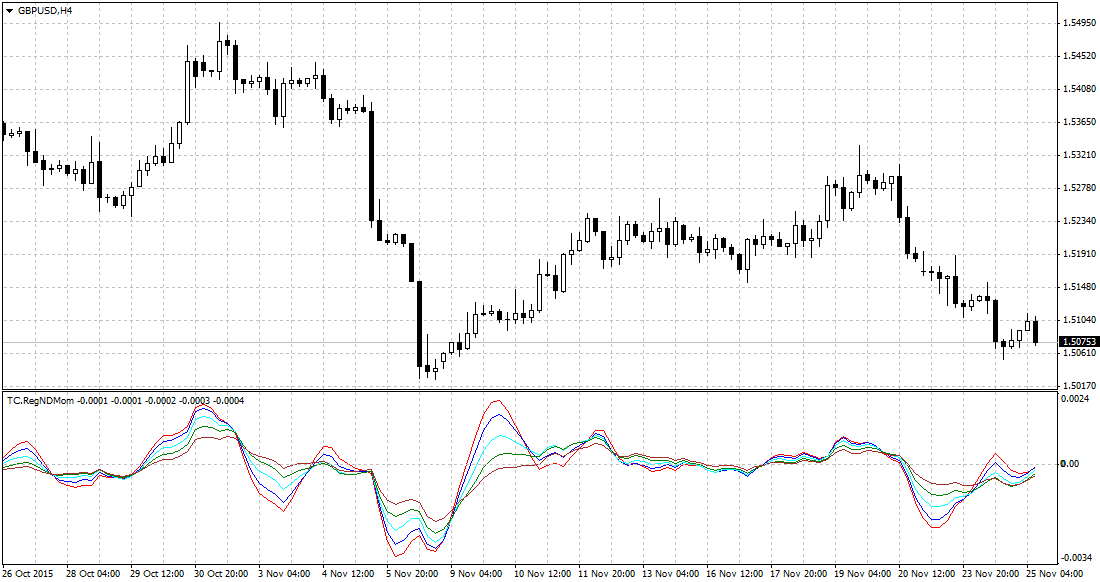
Regularisation is a smoothing technique which can remove unwanted momentum turning points and offers less lag for the same degree of smoothness. As a result, momentum’s trading significance is concentrated into those turning points that remain; so profitable inferences are much easier to make. There is also the ability to create useful momentum indicators and oscillators with very short lengths to provide an early warning system of impending price moves.
GBP/USD 4 hours chart.
2. Buying Selling
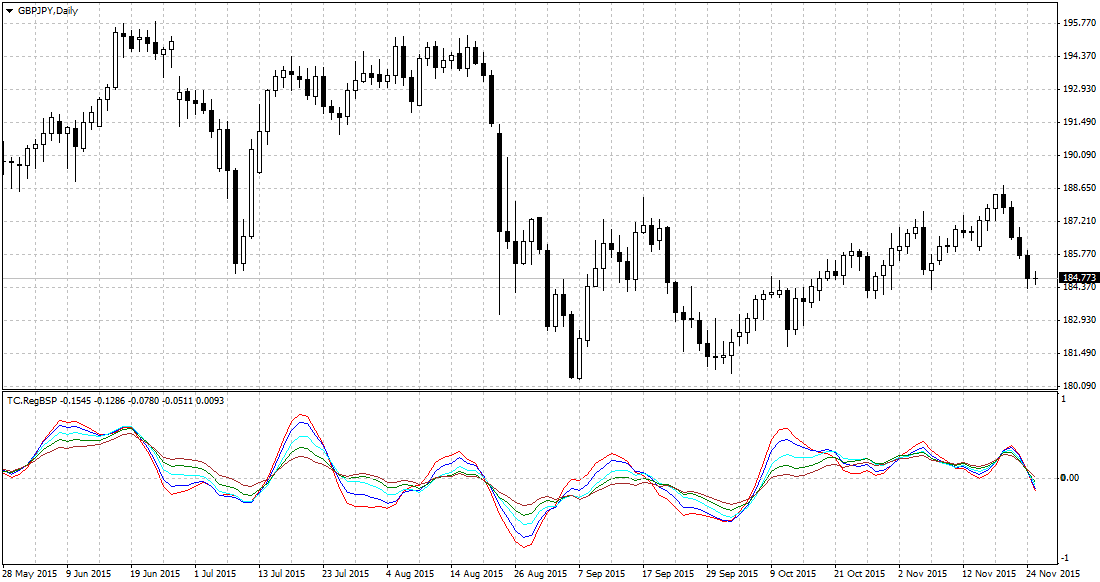
Buying Selling Pressure (BSP) reflects the underlying tendency of close prices to cluster near the highs in an uptrend and near the lows in a downtrend. BSP is a noisy signal and regularisation helps to get rid of noise, therefore making it useful as a trading indicator.
GBP/JPY daily chart.
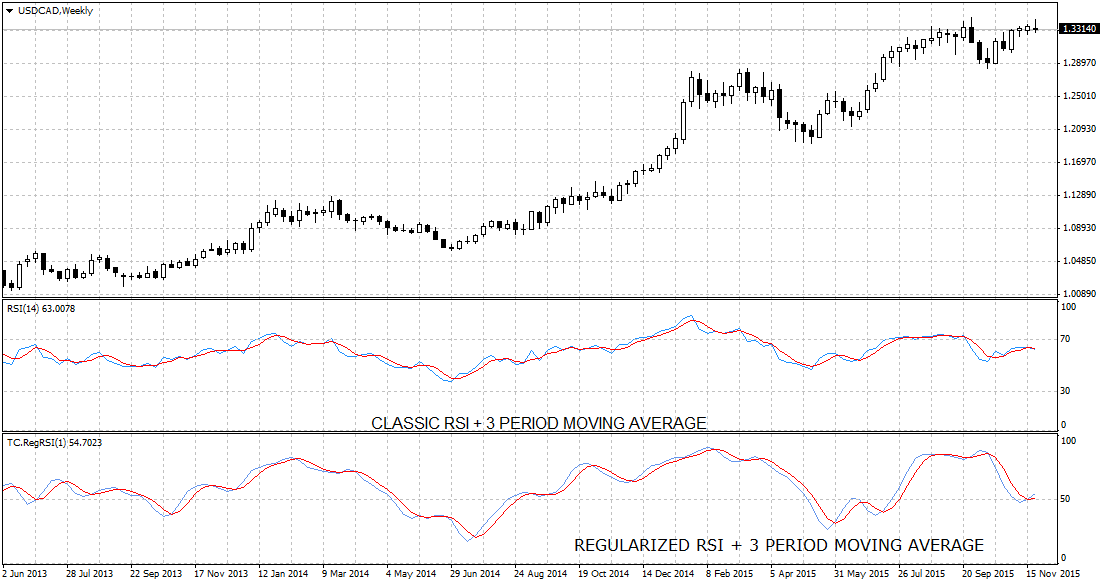
3. Regularised RSI
RSI is used as an operand with an exponential smoothing constant of one and regularisation parameter typically of unity. This usage means regularisation is being used only for smoothing.
USD/CAD weekly chart. TRADING CENTRAL regularised RSI offers less signals and less lags than traditional smoothing technics.
